Dashboard Overview
Overview
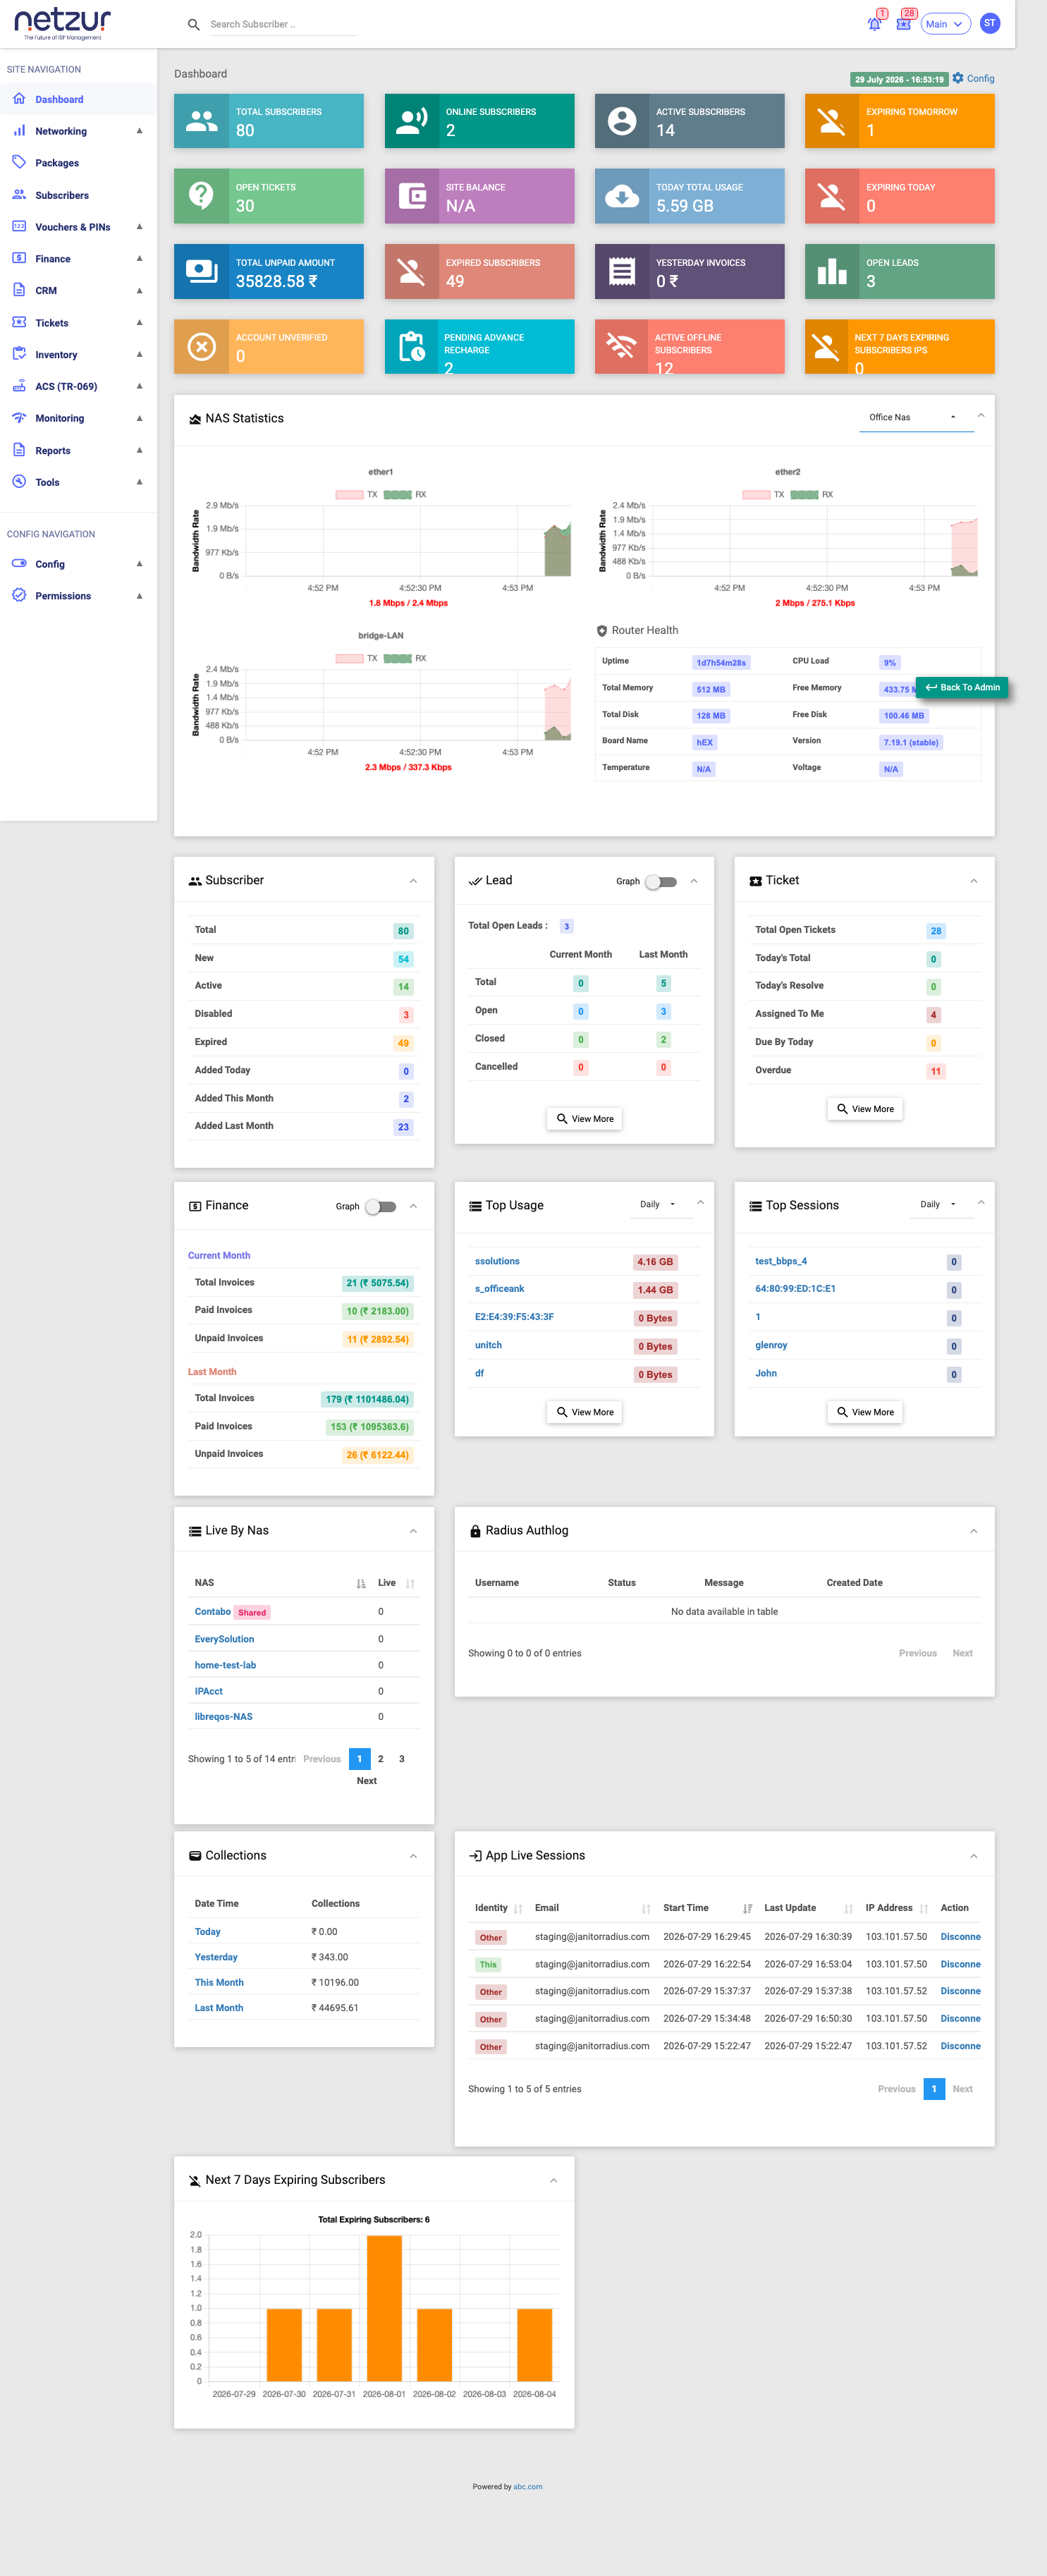
The Dashboard is the home screen of the operator portal. It gives you an at-a-glance summary of your ISP: how many subscribers you have, who is online, money collected and owed, open tickets and leads, and the health of your network. It is the first screen you see after signing in.
The Dashboard is made of two kinds of blocks:
- Info boxes — single-number summaries across the top (for example Total Subscribers, Total Unpaid Amount).
- Report panels — larger tables and charts below (for example Finance, Subscriber, NAS Statistics).
You can choose which blocks appear — see Customize Your Dashboard.
Who Can Use This Feature
Any staff member whose role includes the Dashboard. Each block is controlled separately, so two staff members may see different blocks depending on their permissions.
Required Permissions
- Site Dashboard access to view the Dashboard.
- Each info box and report panel has its own view permission, so you only see the blocks your role allows.
- Update Dashboard Config to change which blocks appear (covered in Customize Your Dashboard).
Prerequisites
- You are signed in.
- For the numbers to be meaningful, your site should already have subscribers, packages and at least one NAS configured.
Navigation
Dashboard (top of the left menu).
Understanding the info boxes
| Info box | What it shows |
|---|---|
| Total Subscribers | All subscribers on the site. |
| Online Subscribers | Subscribers with a live session right now. |
| Active Subscribers | Subscribers whose service is currently active. |
| Expiring Tomorrow | Subscribers due to expire the next day. |
| Expiring Today | Subscribers due to expire today. |
| Expired Subscribers | Subscribers whose service has lapsed. |
| Open Tickets | Support tickets not yet closed. |
| Open Leads | Sales leads still in progress. |
| Site Balance | Prepaid balance for the site (shows N/A if not used). |
| Today Total Usage | Total data used across the site today. |
| Total Unpaid Amount | Money owed across unpaid invoices. |
| Yesterday Invoices | Value of invoices raised yesterday. |
| Account Unverified | Subscriber accounts pending verification. |
| Pending Advance Recharge | Scheduled advance recharges not yet applied. |
| Active Offline Subscribers | Active subscribers who are currently offline. |
| Next 7 Days Expiring Subscribers' IPs | IP addresses tied to subscribers expiring within a week. |
The exact set of info boxes you see depends on your permissions and on what you have chosen to display.
Understanding the report panels
Common panels include:
- Subscriber — totals by state (New, Active, Disabled, Expired, added this month, etc.).
- Finance — this month vs last month invoices, paid and unpaid.
- Collections — money collected today, yesterday, this month, last month.
- Ticket and Lead — open counts and quick summaries.
- NAS Statistics / Router Health — live status of your NAS devices (uptime, CPU, memory).
- Top Usage / Top Sessions — heaviest data users and sessions (daily/weekly/monthly).
- Live By NAS and Radius Authlog — live session counts per NAS and recent authentication attempts.
- App Live Sessions — active portal/app sessions.
- Next 7 Days Expiring Subscribers — upcoming expiries to act on.
Many panels have a View More link that opens the full list or report.
Step-by-Step: read your Dashboard each morning
- Sign in — the Dashboard opens automatically.
- Scan the info boxes for anything unusual (a jump in Expired or Unpaid).
- Check Expiring Today / Tomorrow and follow up on renewals.
- Review Open Tickets and Overdue items in the Ticket panel.
- Check NAS Statistics / Router Health to confirm your network is up.
- Use View More on any panel to drill into the detail.
What Happens After Saving
The Dashboard is a read-only overview — viewing it changes nothing. Actions happen when you follow a View More link into the relevant module.
Important Notes
- Figures are calculated from live data and refresh when you reload the page.
- A filter by subscriber type — Regular, MAC, Lease and Voucher — lets you narrow the view.
- If your site is close to its licence expiry, a warning banner appears at the top with a renewal link.
Common Mistakes
- Treating an empty or
N/Abox as an error — some boxes (like Site Balance) only apply to certain business types. - Expecting live numbers to update without reloading the page.
Troubleshooting
| Problem | Likely cause | What to do |
|---|---|---|
| A box or panel is missing | Your role doesn't include it, or it's turned off in your Dashboard settings | Check Customize Your Dashboard or ask your administrator. |
| Router Health shows nothing | The NAS isn't reachable or isn't set to show on the Dashboard | Check the NAS configuration under Networking → NAS. |
| Numbers look out of date | The page hasn't refreshed | Reload the page. |