Finance Dashboard
Overview
The Finance Dashboard gives you a single at-a-glance view of the money side of your site: what has been invoiced, what has been paid, and what is still owed. It highlights today's activity, lets you drill into totals by month, quarter or year, and ranks your biggest-paying customers and biggest debtors. It's a read-only monitoring screen — every figure links out to the relevant working page for action.
Who Can Use This Feature
Owners, managers and accounts staff who want a financial summary of the site.
Required Permissions
- Other Dashboard → Finance Dashboard.
Navigation
Finance → Dashboard
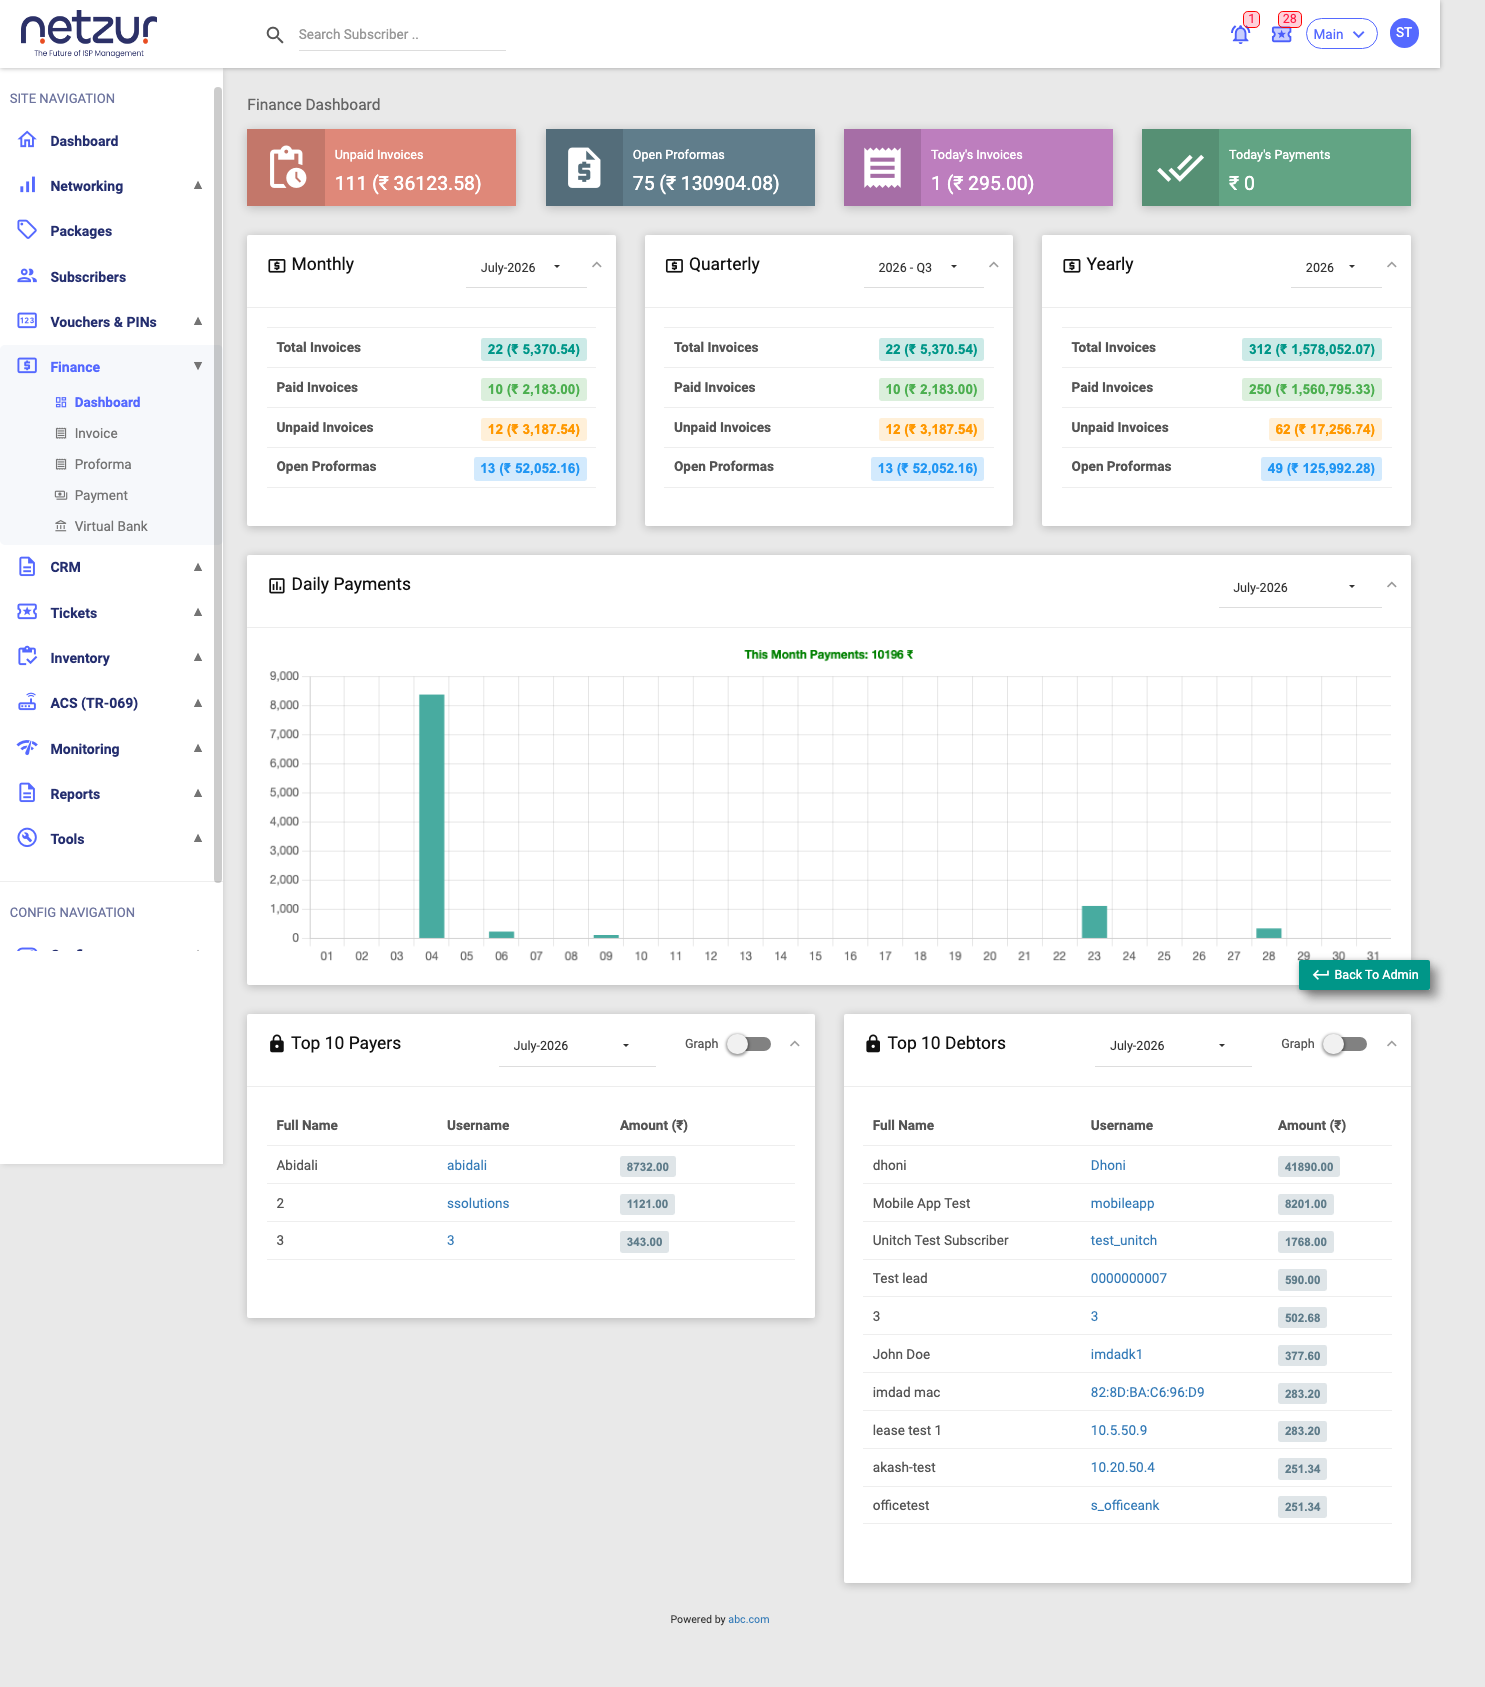
The four info boxes (top row)
Each box shows a count and, in brackets, a money amount. Clicking a box opens the related page.
| Box | Shows | Period |
|---|---|---|
| Unpaid Invoices | How many invoices are still unpaid, and the total amount outstanding. | All-time (current open state) |
| Open Proformas | How many proformas are still open, and their total value. | All-time (current open state) |
| Today's Invoices | How many invoices were raised today, and their total value. | Today |
| Today's Payments | Total money received today. | Today |
"Today" follows your site's timezone, not the server's.
Period summaries (Monthly / Quarterly / Yearly)
Three side-by-side cards, each with its own period selector. Every card shows the same four rows for the chosen period:
| Row | Meaning |
|---|---|
| Total Invoices | Count and total value of all invoices in the period. |
| Paid Invoices | Count of paid invoices and the total amount paid. |
| Unpaid Invoices | Count still unpaid and the outstanding amount for the period. |
| Open Proformas | Count and value of open proformas in the period. |
- Monthly — pick any of the last 13 months.
- Quarterly — pick a quarter (shown as
year - Qn). - Yearly — pick any of the last 10 years.
Each card collapses/expands with the chevron.
The Unpaid Invoices info box at the top is all-time; the Unpaid Invoices row inside these cards is only for the selected period. Same name, different scope.
Daily Payments chart
A bar chart of money received per day for a chosen month. Each bar is one day; its height is that day's total payments. The green title shows the month's grand total (This Month Payments: …), and hovering a bar shows that day's amount. Use the month selector above the chart to change the month.
Top 10 Payers and Top 10 Debtors
Two cards ranking subscribers for a chosen month:
- Top 10 Payers — the customers who paid you the most.
- Top 10 Debtors — the customers who owe you the most (largest outstanding amounts).
Each shows Full Name, Username (links to the subscriber), and Amount. Use each card's month selector to change the period, and the Graph toggle to switch between the table and a pie chart. If there's no data, the card shows No data available.
Important Notes
- Every number is for your site only and shown in your site's currency.
- The dashboard is read-only — use the links on each widget (or the Finance menu) to actually raise invoices, receive payments, and so on.