Inventory Dashboard
Overview
The Inventory Dashboard is the landing screen of the Inventory area. It gives you an at-a-glance picture of your stock: four summary tiles, a chart that breaks your equipment down by status, and a timeline of recent inventory activity.
Required Permissions
- Other Dashboard → Inventory Dashboard.
Navigation
Inventory → Dashboard
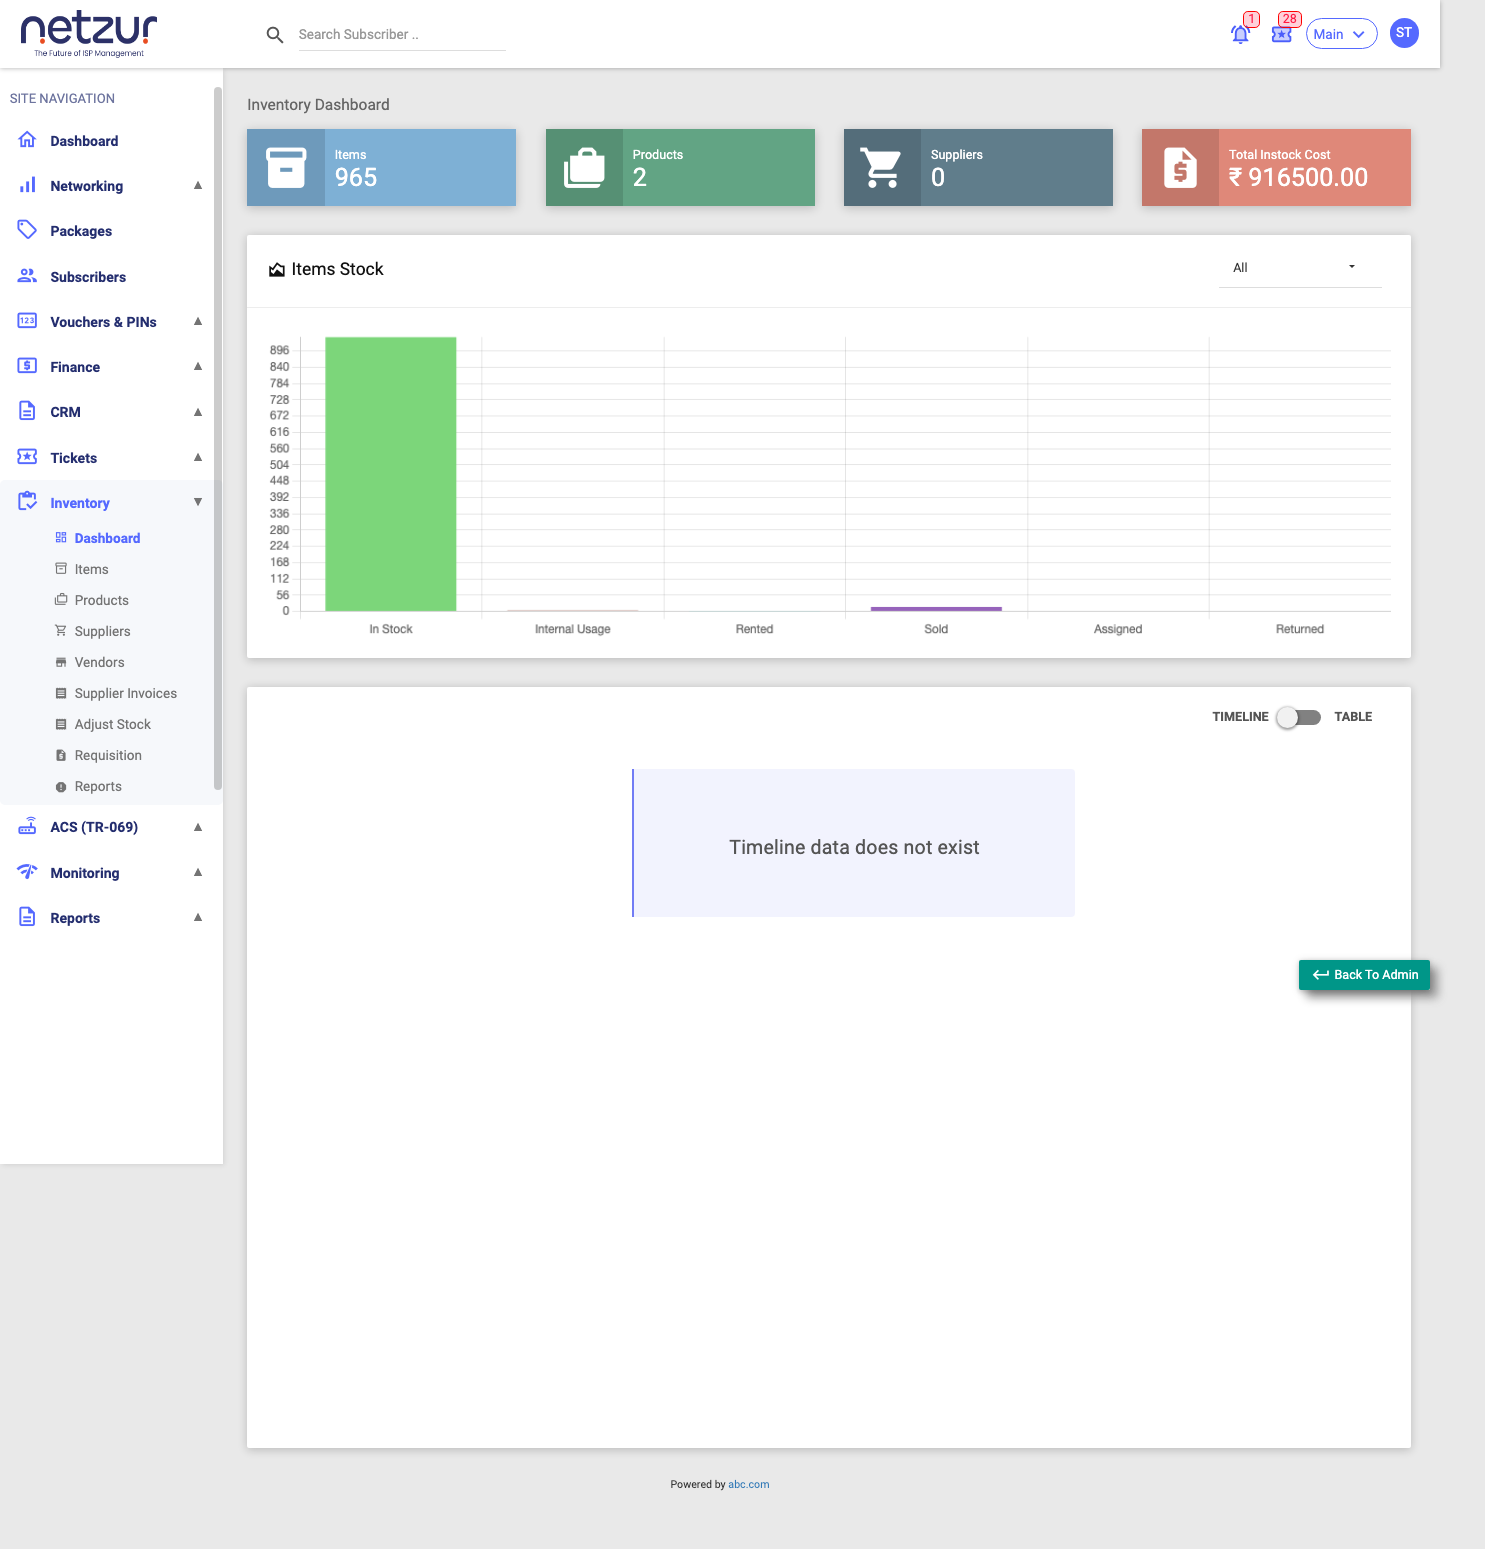
The summary tiles
Four cards across the top. The first three are clickable and jump to the matching list.
| Tile | Shows | Click to… |
|---|---|---|
| Items | Total number of individual physical units on record (every status). | Open the Items list. |
| Products | Total number of distinct product types in your catalogue. | Open the Products list. |
| Suppliers | Total number of suppliers on record. | Open the Suppliers list. |
| Total In Stock Cost | The combined cost value of everything still In Stock (shown in your site currency). | — (not clickable) |
The Items Stock chart
A bar chart titled Items Stock that counts your items by status — one bar each for In Stock, Internal Usage, Rented, Sold, Assigned, and Returned.
A product dropdown at the top-right of the chart defaults to All; pick a single product to redraw the chart for just that product.
The activity timeline
Below the chart is a running feed of recent inventory activity — items added, sold, rented, returned, and so on — showing who did what and when.
Important Notes
- There are no date filters on the dashboard. The only controls are the product dropdown on the chart (and, for head-office/admin logins, a site selector).
- The Total In Stock Cost tile counts only In-Stock items, so it reflects the value of equipment you could still sell or hand out.