Monitoring Dashboard
Overview
The OLT Dashboard is the landing screen for network monitoring. It summarises your whole fibre fleet in a row of tiles and surfaces the ONUs that need attention — weak signal, offline, or newly discovered — so you can act before customers call.
Required Permissions
- OLT → List and ONU → List control which tiles and lists you see.
Navigation
Monitoring → Dashboard
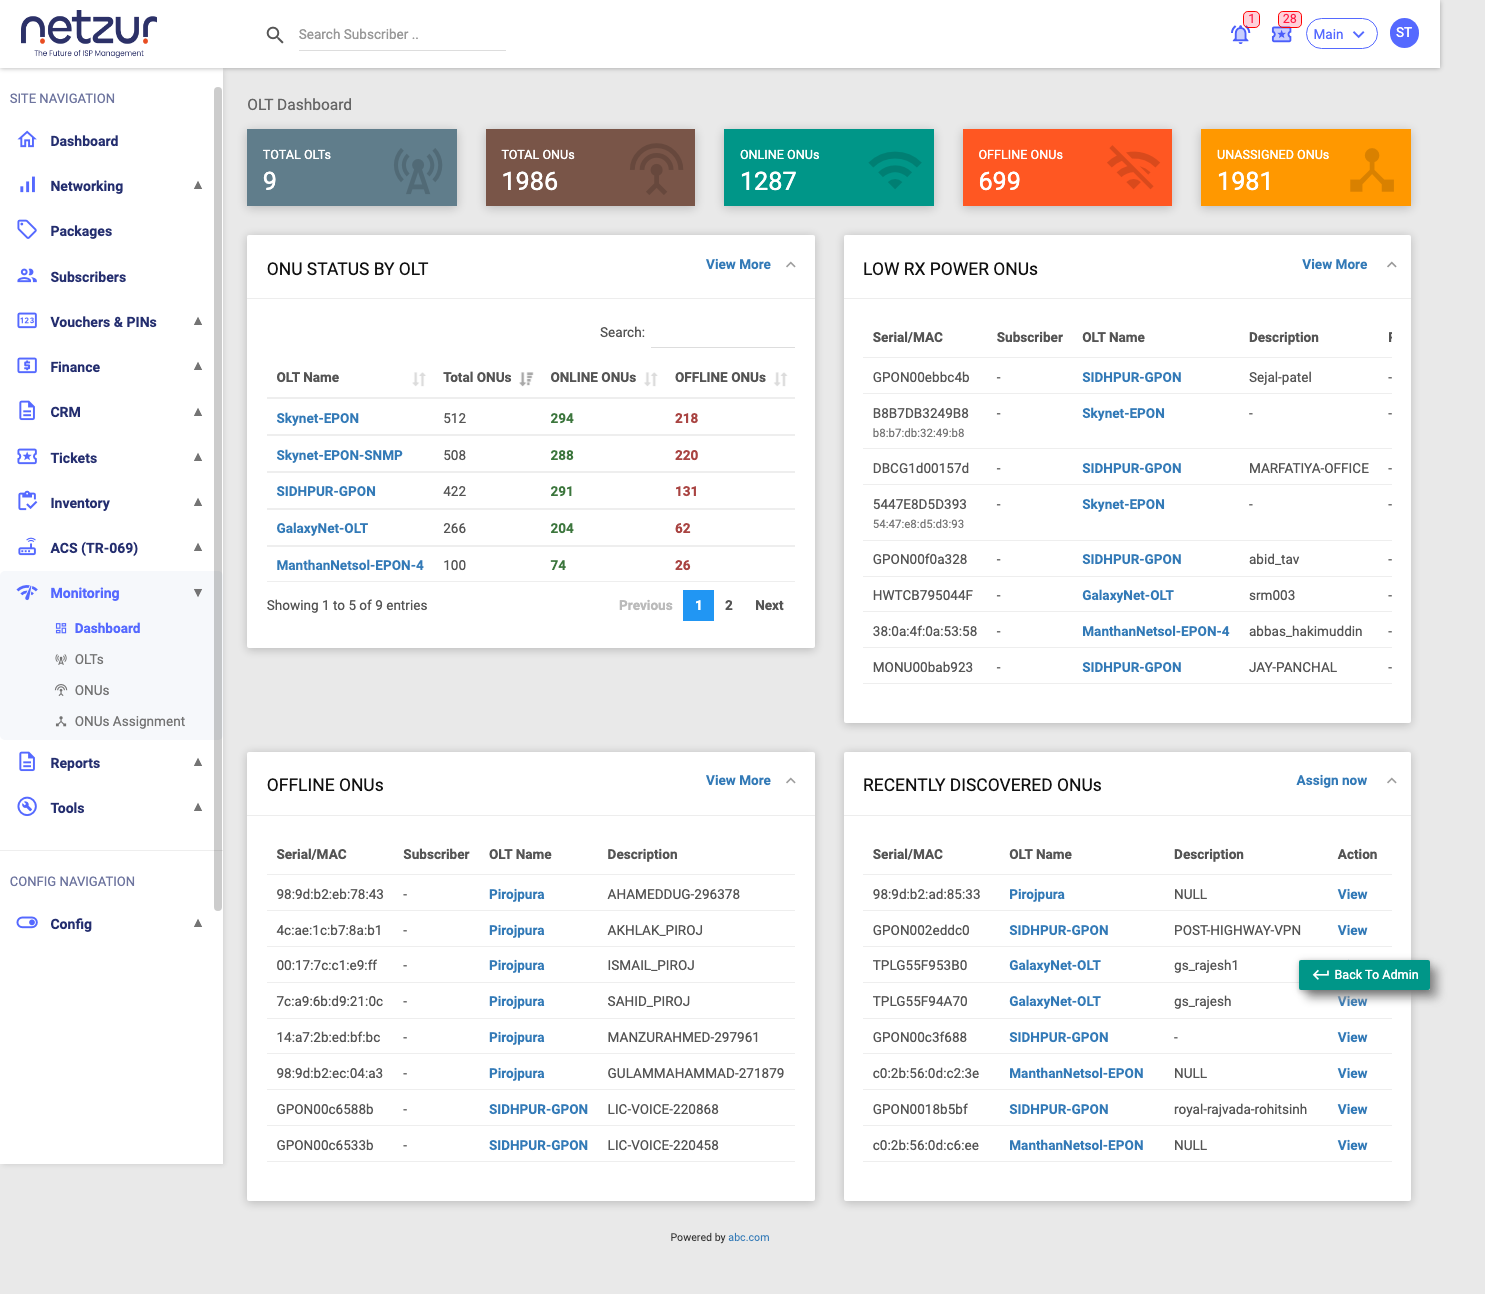
The stat tiles
Five tiles across the top — each is clickable and opens the matching list.
| Tile | Shows |
|---|---|
| Total OLTs | Number of OLTs you monitor. |
| Total ONUs | Every customer ONU across those OLTs. |
| Online ONUs | ONUs that were online at the last poll. |
| Offline ONUs | ONUs the OLT couldn't see at the last poll. |
| Unassigned ONUs | Discovered ONUs not yet linked to a subscriber. |
The problem panels
Below the tiles, four panels list the ONUs worth looking at (each with a View More link to the full, filtered ONU list):
- ONU Status by OLT — a per-OLT summary: OLT name (links to the OLT page), total, online and offline counts.
- Low RX Power ONUs — ONUs whose signal is weak (below the low-signal threshold). Shows serial/MAC, subscriber, OLT, and the RX/TX power. These are your early-warning cases.
- Offline ONUs — ONUs currently down.
- Recently Discovered ONUs — the newest ONUs not yet assigned to a subscriber, each with an Assign now link to the assignment screen.
Important Notes
- The figures load when you open the page and don't auto-refresh — reload to get the latest (which itself is only as fresh as the last poll).
- Use Low RX Power ONUs proactively: a customer with weak light today is often a dropped connection tomorrow.