The OLT Page
Overview
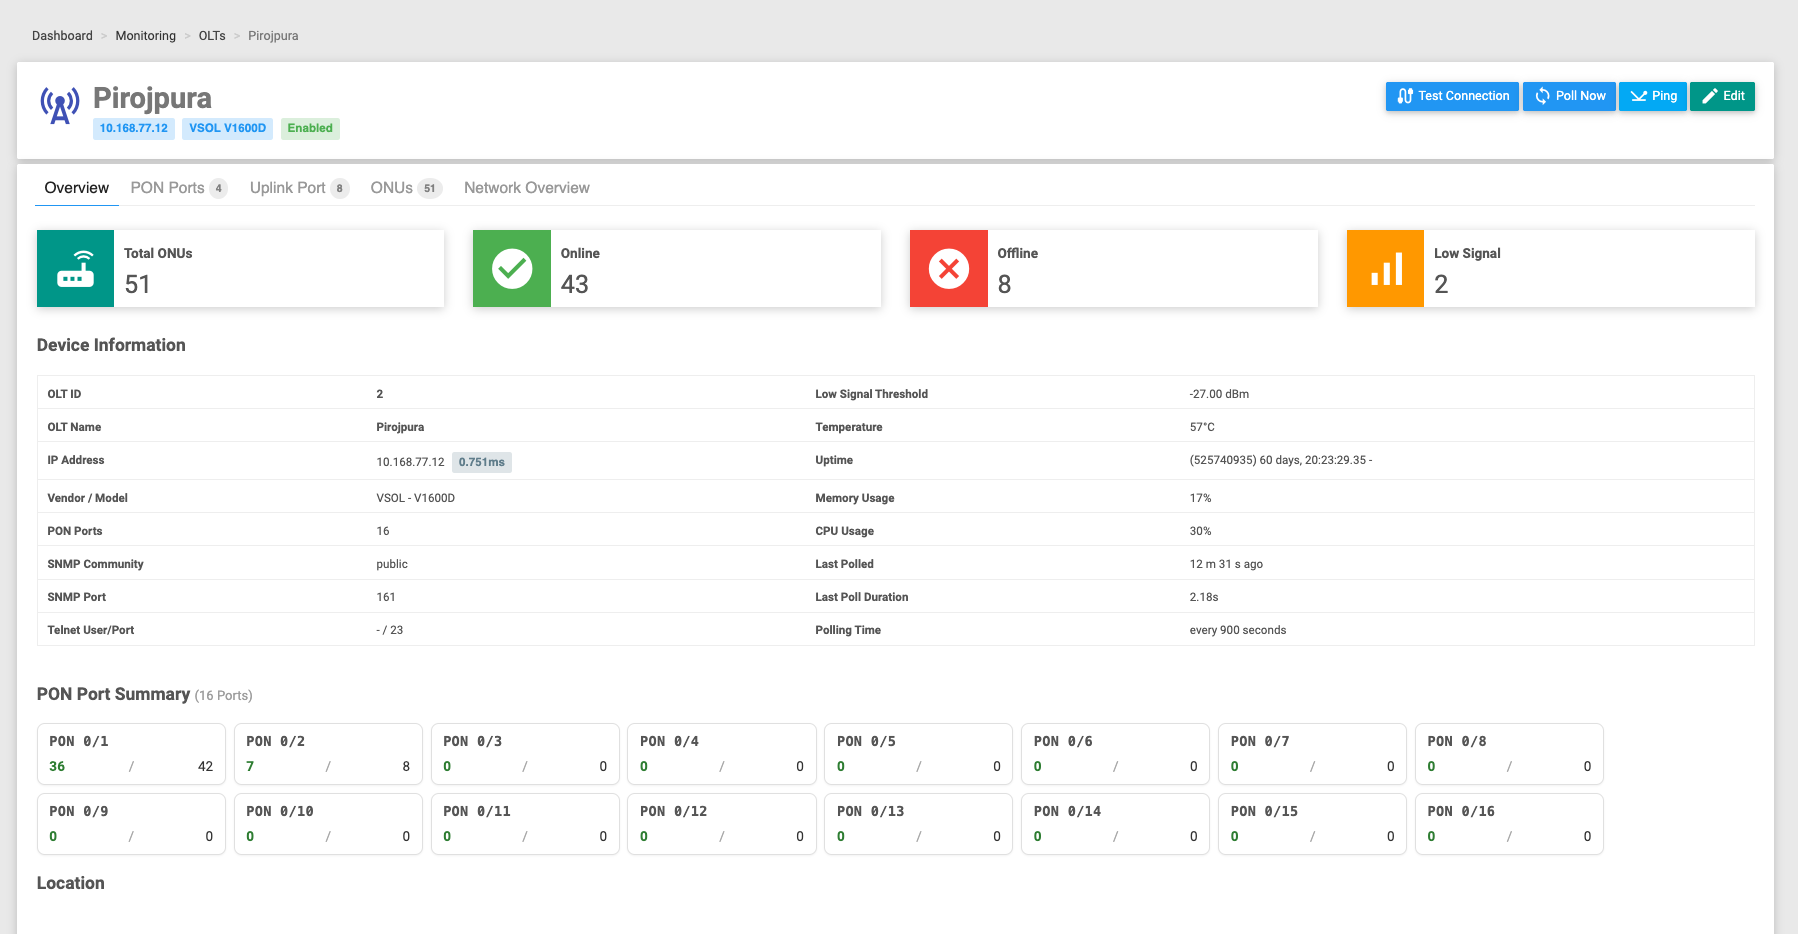
Clicking an OLT's name opens its detail page — the command centre for that box. A header with quick actions sits on top, and five tabs break down everything the last poll found: Overview, PON Ports, Uplink Port, ONUs, and Network Overview.
Navigation
Monitoring → OLTs → (click an OLT)
The header and actions
The header shows the OLT name, its IP address, vendor/model, and an Enabled / Disabled badge. On the right:
| Action | What it does |
|---|---|
| Test Connection | Checks that the OLT is reachable and that its configured protocol and credentials actually work — a full handshake, not just a ping. It tests according to the OLT's protocol: for an SNMP OLT it checks the SNMP port using the community; for a Telnet (CLI) OLT it checks the Telnet port using the username and password. You get a clear success or an error message. Use this after adding or editing an OLT to confirm the settings are right. |
| Poll Now | Reads the OLT now — refreshes every figure on the page (ONU counts, ports, signal levels). Runs in the background; the page updates once the poll finishes. (Shown only when the OLT is Enabled.) |
| Ping | A quick "is the box responding?" check against its management IP — updates the reachability indicator. |
| Edit | Opens the OLT form. |
The three checks answer different questions: Ping — is the IP responding at all? Test Connection — do the polling protocol and credentials work? Poll Now — do a full data read now. All three reach the live device.
:::tip Test Connection vs Ping A device can answer Ping yet still fail Test Connection — for example if the SNMP community is wrong or the Telnet port is blocked. If polling isn't updating, run Test Connection first: it pinpoints whether the problem is the connection settings rather than the network. :::
Overview tab
The landing tab, with four summary tiles counting this OLT's ONUs:
| Tile | Meaning |
|---|---|
| Total ONUs | Every ONU on this OLT. |
| Online | ONUs online at the last poll. |
| Offline | ONUs the OLT couldn't see. |
| Low Signal | Online ONUs whose light level is weak (below the threshold). |
(Each tile is clickable — it jumps to the ONUs tab filtered to that state.)
Below the tiles:
- Device Information — the OLT's facts: OLT ID, low-signal threshold, IP (with its ping time), vendor/model, PON port count, connection settings, Last Polled time and poll duration, and Polling Time (the interval). Live-read values — temperature, uptime, memory and CPU — show a dash until the OLT has been polled.
- PON Port Summary — a grid of cards, one per PON port, each showing online / total ONUs on that port. Click a card to see just that port's ONUs.
- Location — a map showing where the OLT is (if coordinates were saved).
PON Ports tab
A PON port is a single fibre port that fans out to many customer ONUs.
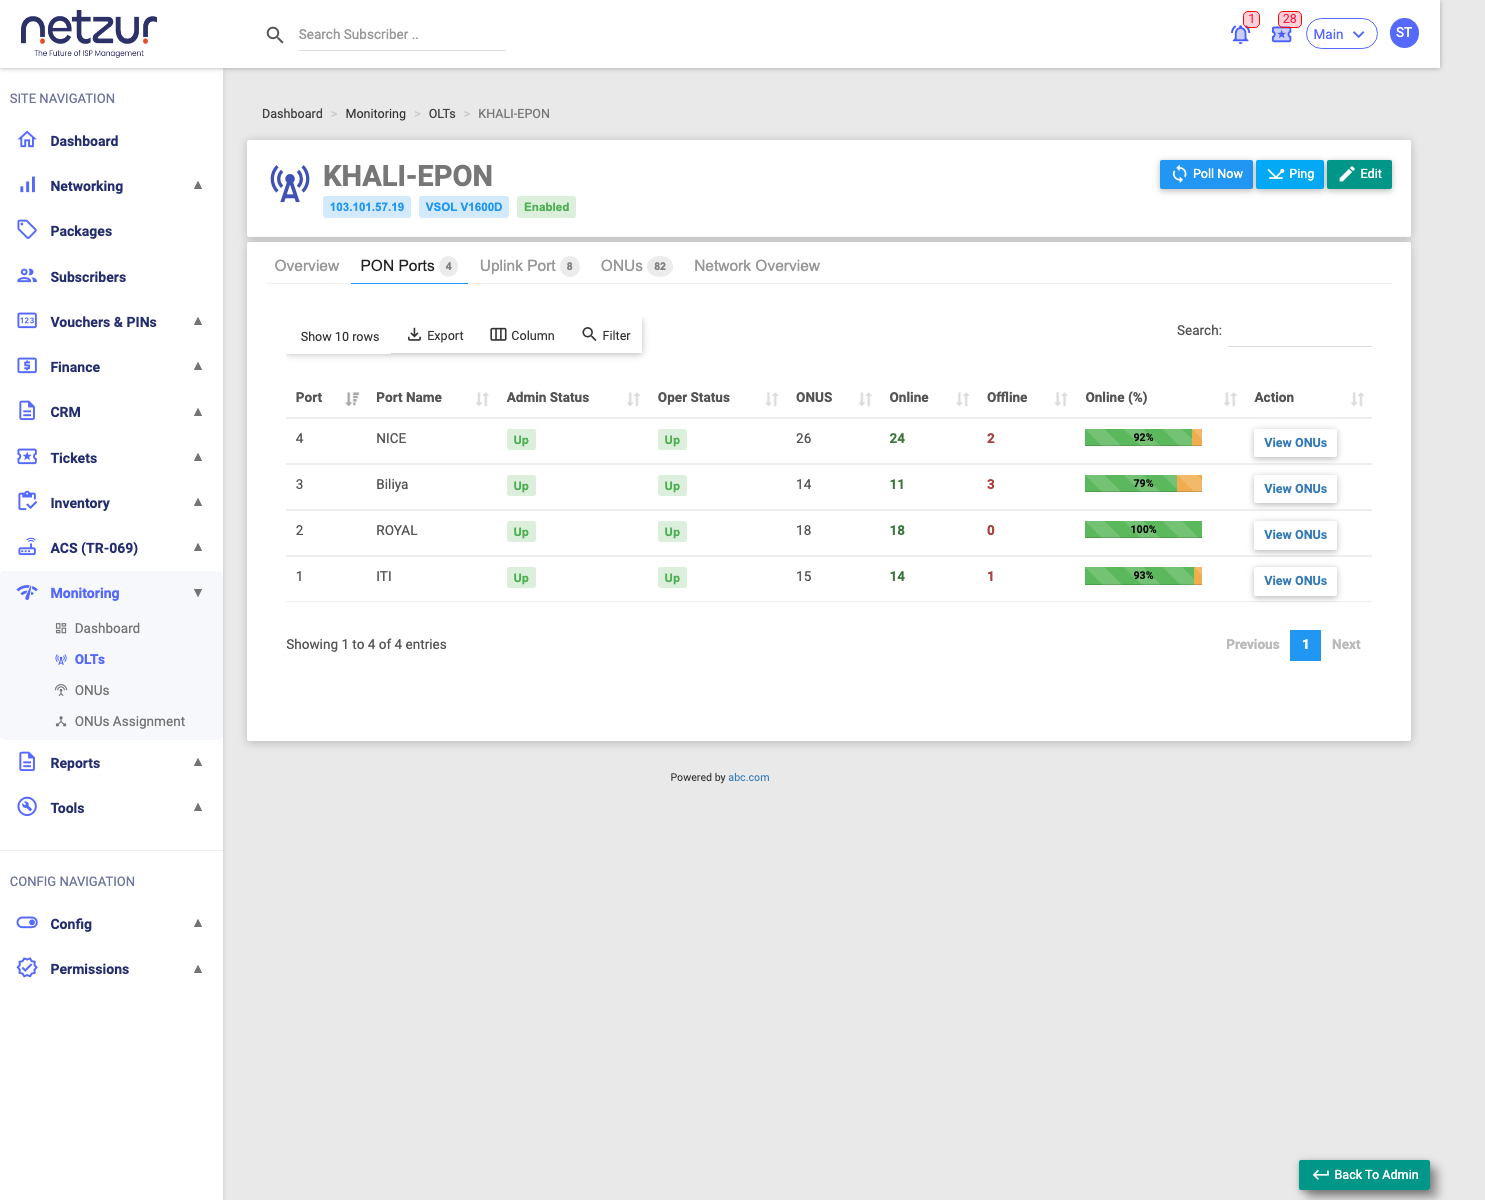
| Column | Meaning |
|---|---|
| Port / Port Name | The port number and its name. |
| Description | Any label on the port. |
| Admin Status | Whether the port is configured on (Up) or off (Down). |
| Oper Status | Whether the port is actually working (Up) or not (Down). |
| ONUS / Online / Offline | Total, online and offline ONU counts on this port. |
| Online Percentage | A bar showing the share of ONUs online — a quick health read for the whole port. |
| Action | View ONUs — opens the ONUs tab filtered to this port. |
Admin vs Oper is the classic "should be on" vs "is actually on". A port that's Admin Up but Oper Down points to a fault on that fibre.
Uplink Port tab
Uplink ports connect the OLT up to your core/backbone network (as opposed to the PON ports that face customers).
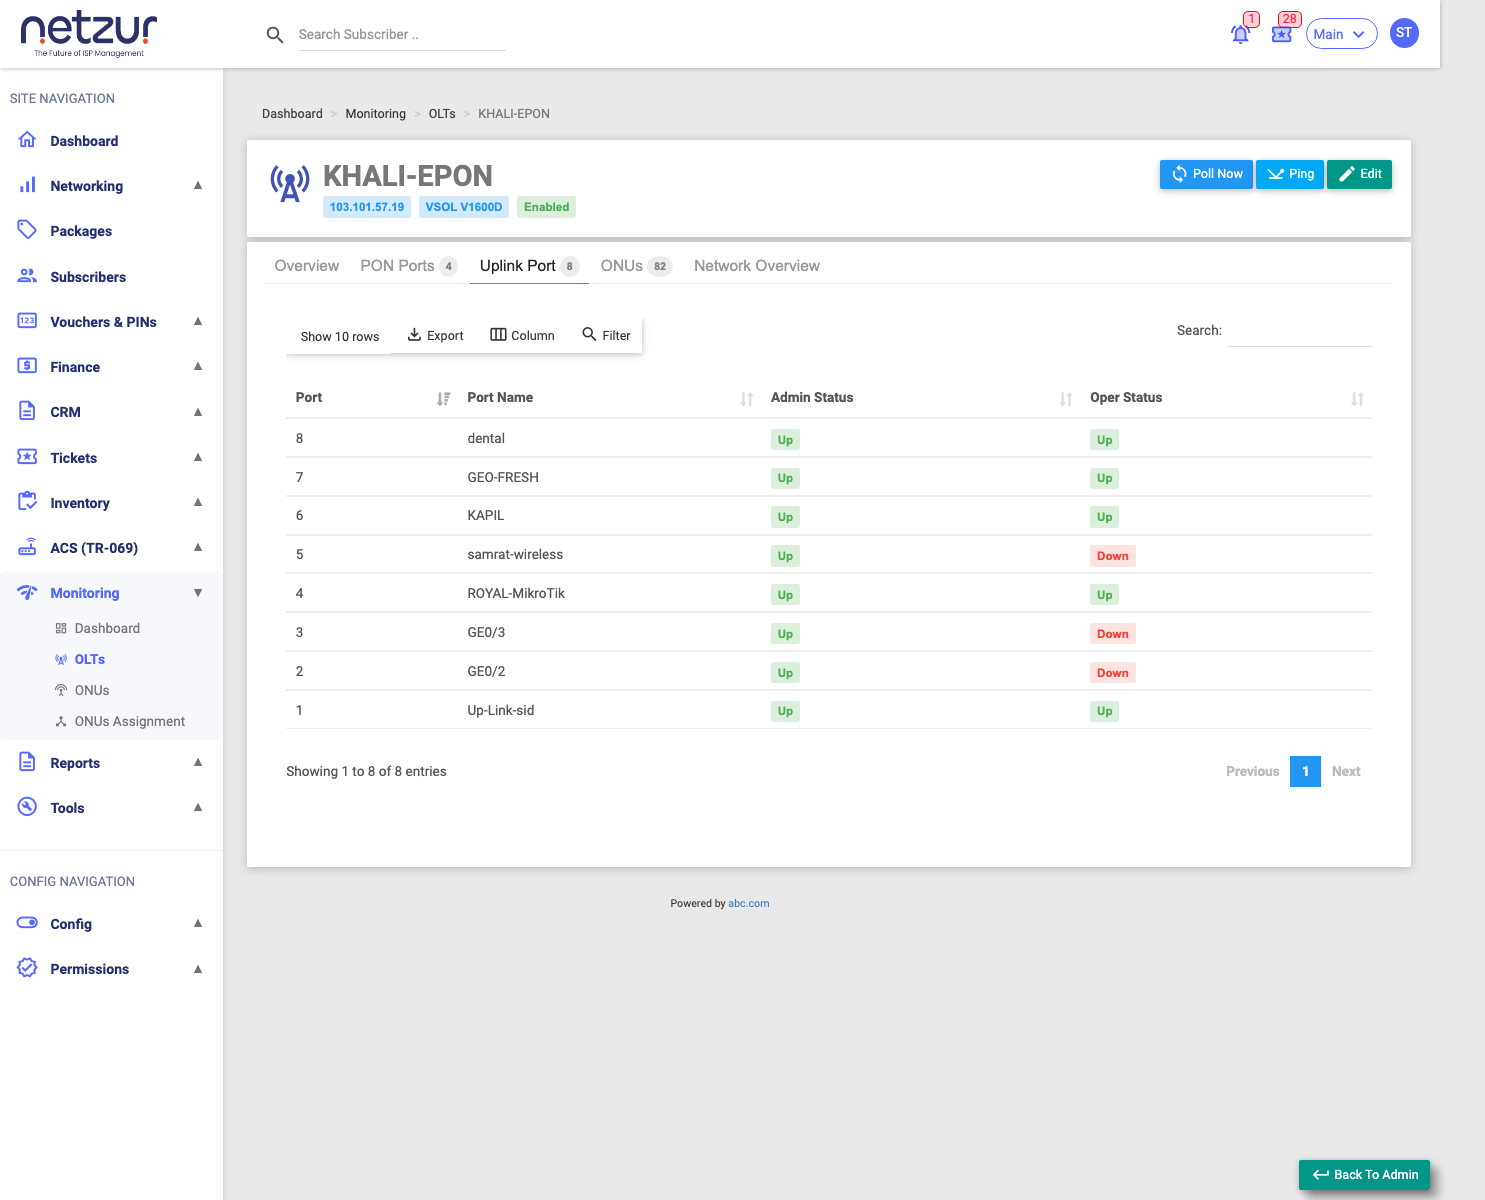
Columns: Port, Port Name, Description, Admin Status and Oper Status (Up/Down). If an uplink shows Oper Down, the whole OLT may be cut off from the network.
ONUs tab
The full list of customer ONUs on this OLT.
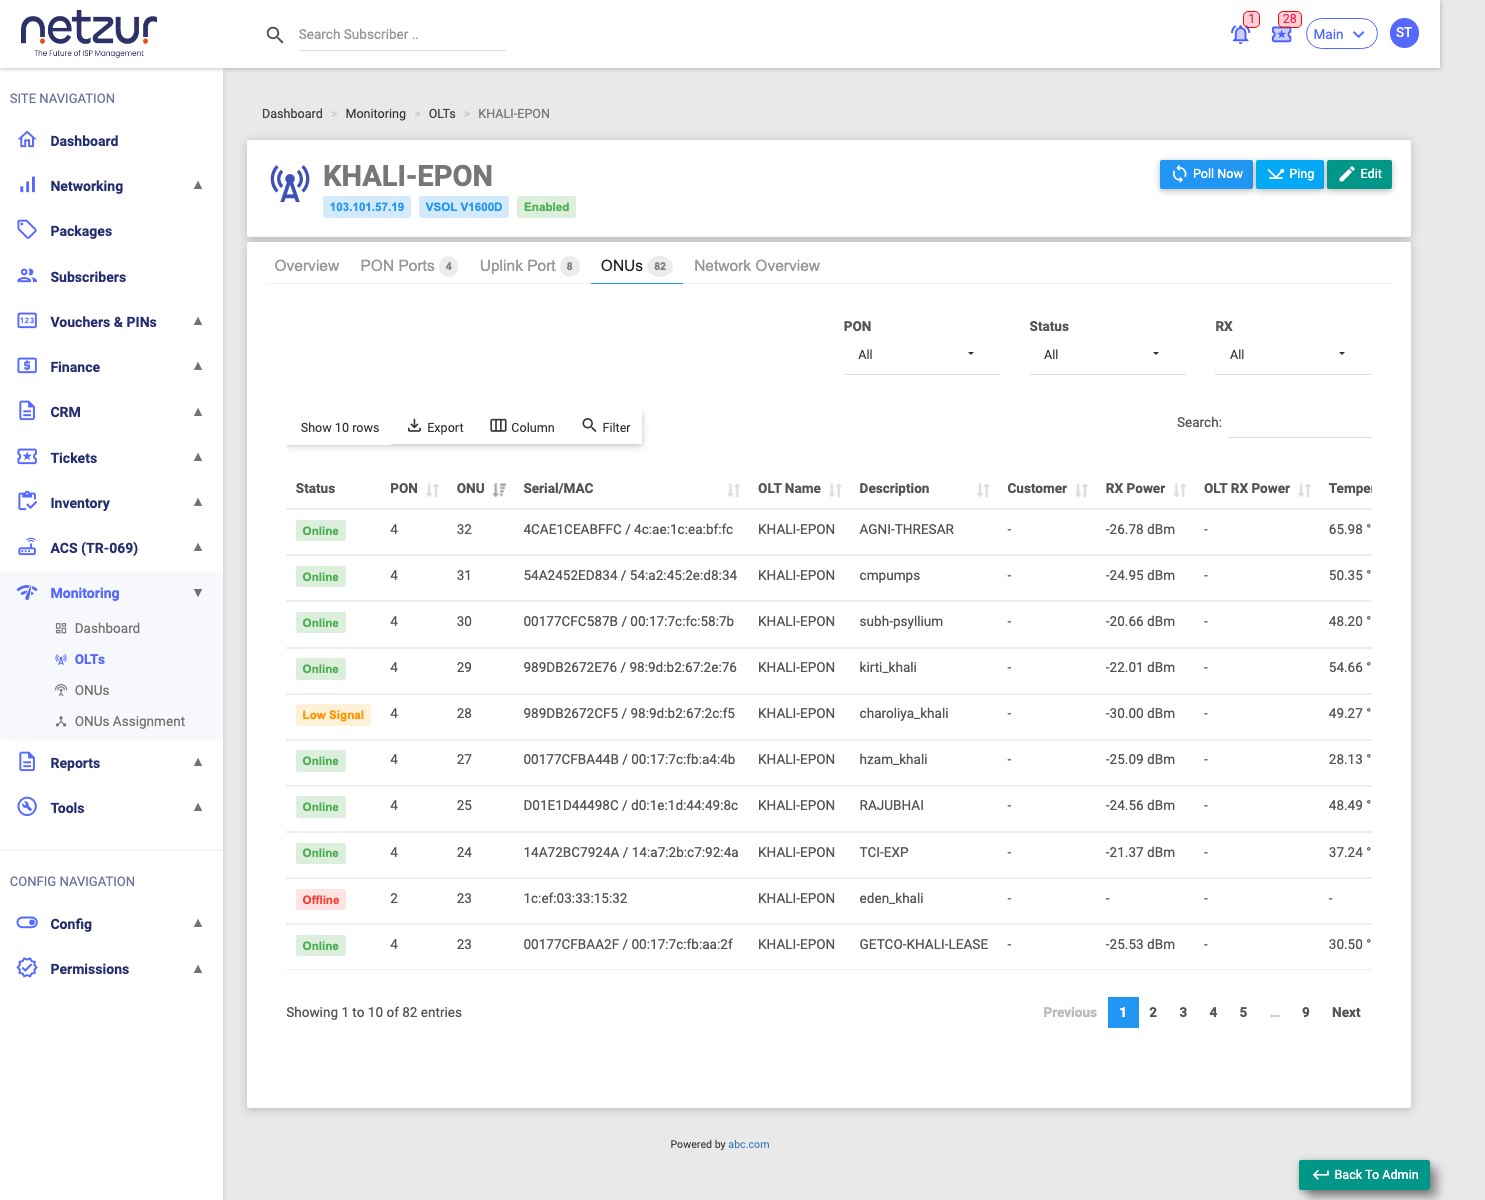
Filters: PON (by port), Status (Online / Offline / Low Signal), and RX (optical-power bands — healthy ≥ −25 dBm, marginal −25 to −27 dBm, weak below −27 dBm).
Key columns: Status (Online / Low Signal / Offline badge), PON, ONU (its index), Serial / MAC, Description, Customer (the linked subscriber, or -), RX Power (the light the ONU receives — the main health figure), TX Power, OLT RX Power (the light the OLT receives back from the ONU), Last Seen, Distance, Temperature, Voltage, and a View button opening the ONU details.
Network Overview tab
A clickable topology diagram of the whole OLT — the box at the centre, each PON port branching off it, and every ONU hanging off its port, colour-coded by status (green online, orange low signal, red offline).
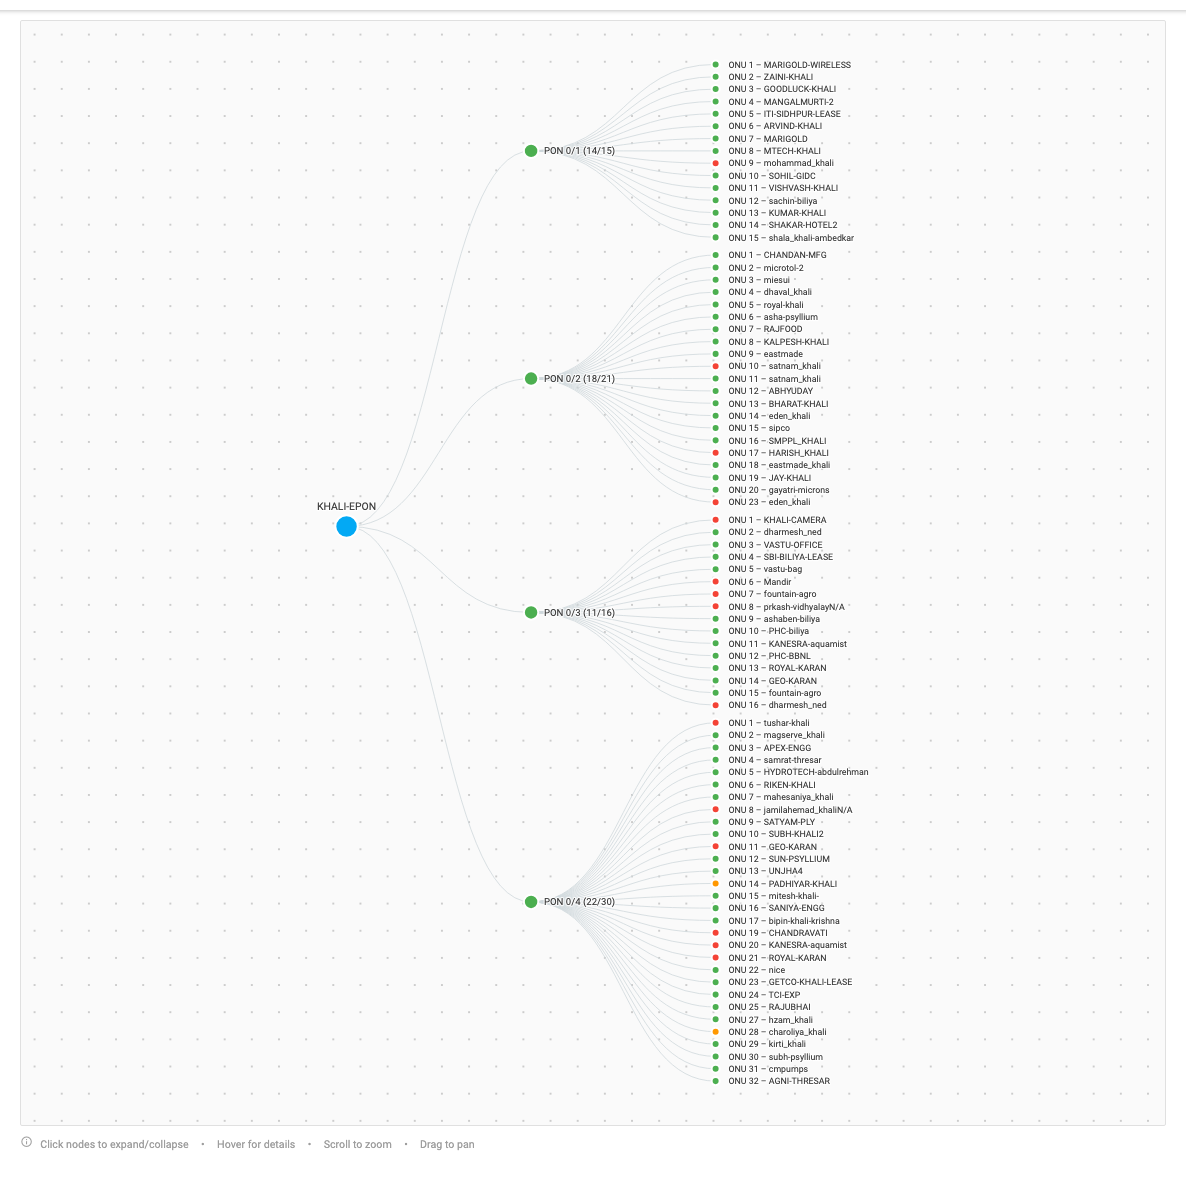
- The legend (top-right) explains the colours.
- Zoom In / Zoom Out / Reset and a Vertical toggle control the view; you can scroll to zoom, drag to pan, and click a node to expand/collapse it.
It's a family-tree picture of your fibre: at a glance you see which ports and customers are up, weak, or down.
Important Notes
- Everything on this page is from the last poll — check Last Polled on the Overview tab, or hit Poll Now for a fresh read.
- The Low Signal count and colours are your best early-warning of fibre trouble.