NAS Statistics and Reachability
Overview
Netzur IMBS continuously checks whether each NAS is reachable and, for supported devices such as MikroTik, can show live statistics — uptime, CPU and memory use, and interface traffic. This helps you spot a router that is down or overloaded before customers start calling.
Who Can Use This Feature
Network administrators and engineers, and support staff monitoring network health.
Required Permissions
- NAS → List / Show to view the NAS list and a device's statistics.
Prerequisites
- The NAS is registered and, for live statistics, has its monitoring/API details configured (see Add a NAS).
Navigation
- Reachability:
Networking → NAS(the Status column). - Live statistics:
Networking → NAS→ open a device (Edit) → the device-type tab (e.g. Mikrotik) → NAS Statistics.
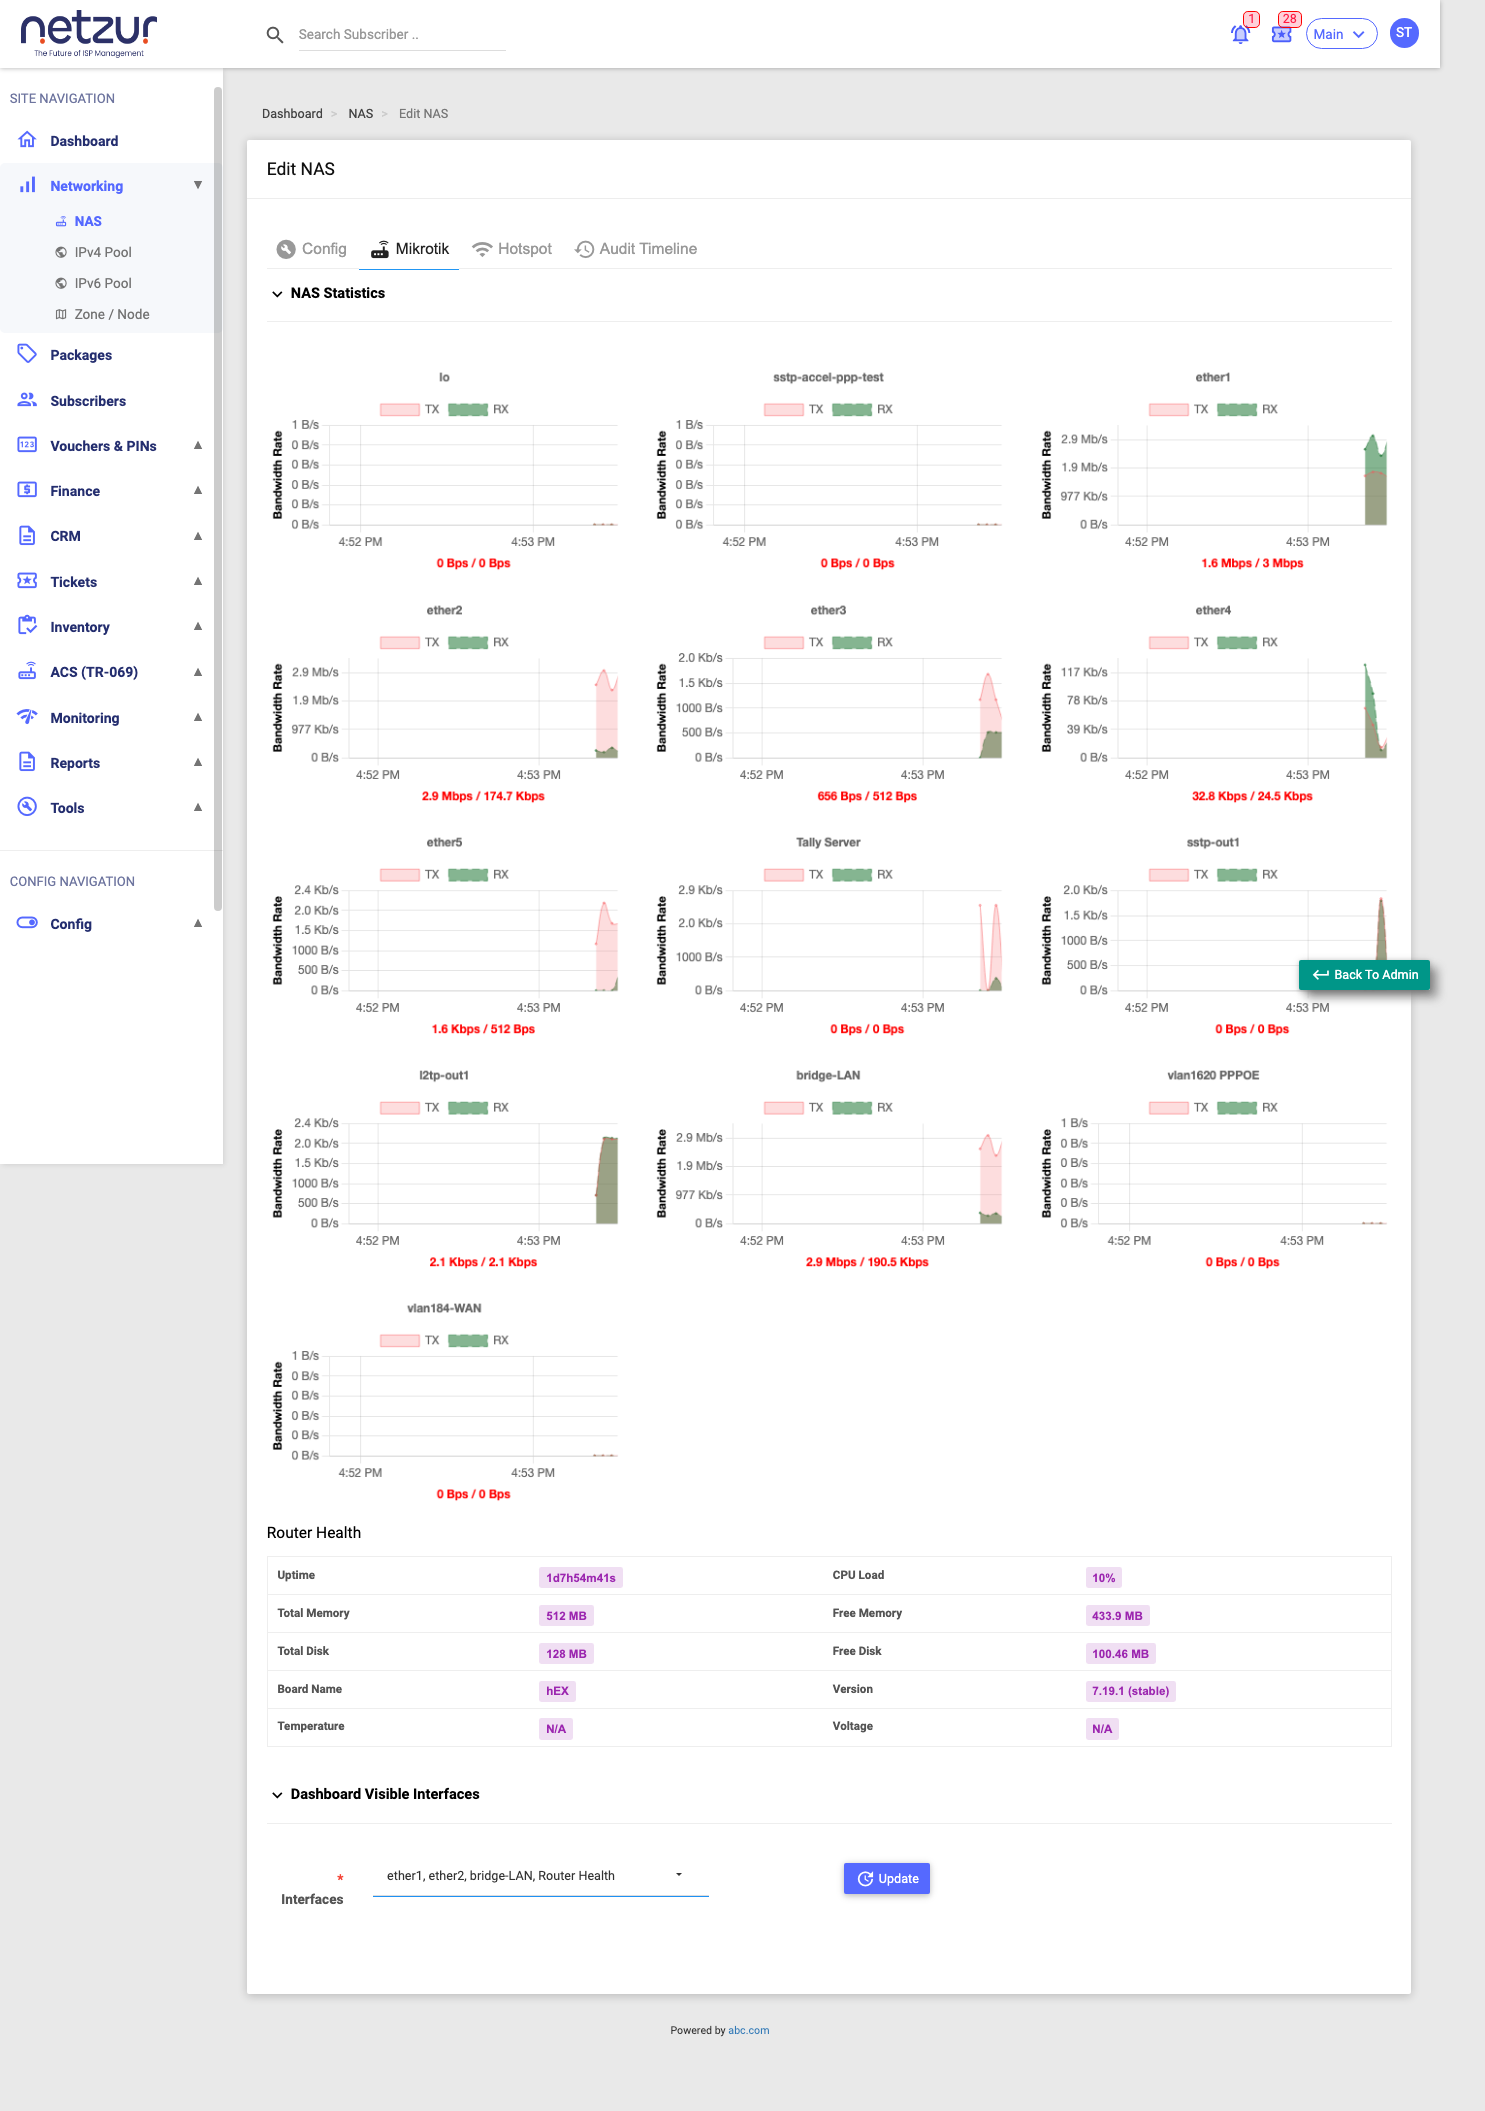
Reading the Status column
| Status | Meaning |
|---|---|
| OK (…ms) | The NAS responded to the reachability check, with the response time. |
| Unreachable | Netzur could not reach the NAS on its last check. |
| Disabled | Reachability checking is turned off for this NAS. |
Live statistics (supported devices)
Selecting Statistics on a supported NAS shows live device information, which typically includes:
- Uptime, CPU load, total/free memory, total/free disk
- Board name and firmware version
- Temperature / voltage where the device reports them
- Interface traffic for the interfaces chosen to display
The main Dashboard also has a Router Health panel summarising this for a selected NAS.
⚠ These figures are read live from the router over its management API. They reflect the real device.
What Happens After Saving
This is a read-only, monitoring feature — viewing statistics changes nothing on the device.
Important Notes
- Unreachable means the last check failed — confirm the device is really down before acting; it can also be a firewall or credential issue.
- Live statistics need the device's monitoring/API details to be set correctly on the NAS.
Common Mistakes
- Assuming Unreachable always means an outage — check the network path and API credentials too.
- Expecting live statistics from a device type that doesn't support them.
Troubleshooting
| Problem | Likely cause | What to do |
|---|---|---|
| No statistics shown for a MikroTik | Monitoring/API details missing or wrong | Edit the NAS and confirm the router API details. |
| Status stuck on Unreachable | Device down, firewall, or wrong IP | Verify the device is up and reachable from the server. |