Online & Usage Reports
These reports tell you what is happening on your network right now and over time — who is connected, who isn't, and how much data everyone is using.
All four reports share the standard report interface (filter bar → Search → results table with Column chooser and Export). See How every report works for the basics.
Online Subscriber
Menu: Reports → Online Subscriber
Shows every subscriber who has a live, open session right now — i.e. everyone connected to your network at this moment, on which access device (NAS), with what IP and MAC, and how much data they have used this session.
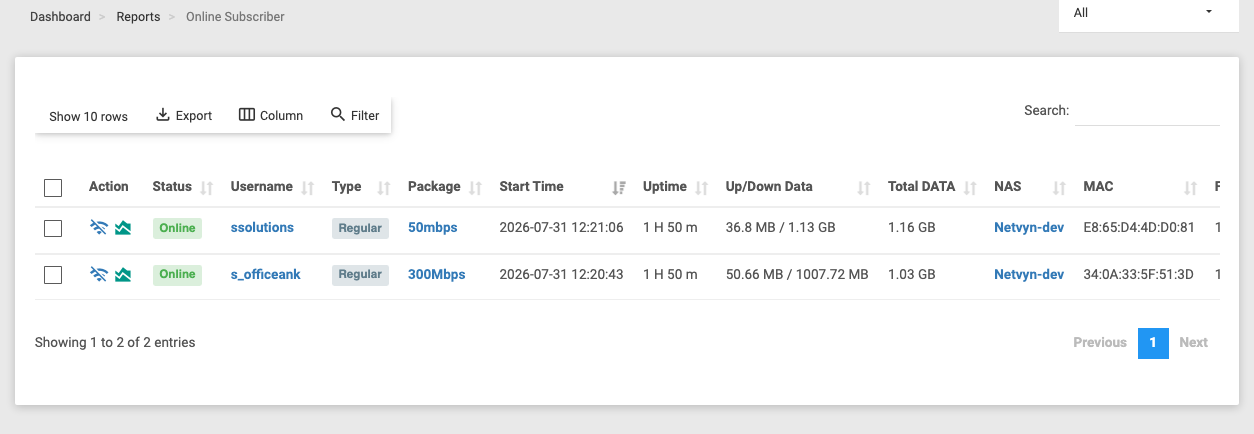
Use it when you want a real-time picture of who is online, to troubleshoot a specific customer's connection, or to disconnect a session.
Filters
| Filter | What it does |
|---|---|
| NAS device | Show sessions on all access servers/routers, or narrow to one. |
There is no date range — this report is always "now". Ending a session removes its row.
Key columns: Status (Online / Blocked), Username, Package, Start Time, Uptime, Up/Down Data, Total Data, NAS, MAC, IP address, plus full contact and account columns.
Actions
- Disconnect session (per-row icon) — drops that one session. Requires the disconnect permission.
- Subscriber Traffic — a small live traffic chart for that subscriber.
- Action → Disconnect (bulk) — tick multiple rows and disconnect them together; you're asked for a Remark, which is written to the event log for each subscriber. Requires the multi-disconnect permission.
:::caution Disconnecting is a live action Disconnecting drops the customer's active internet session. Only do this when you intend to. :::
Active Subscribers History
Menu: Reports → Active Subscribers History
A trend of how many subscribers were active over time, drawn from stored daily snapshots. It answers "is my active base growing or shrinking?" rather than listing individual customers.
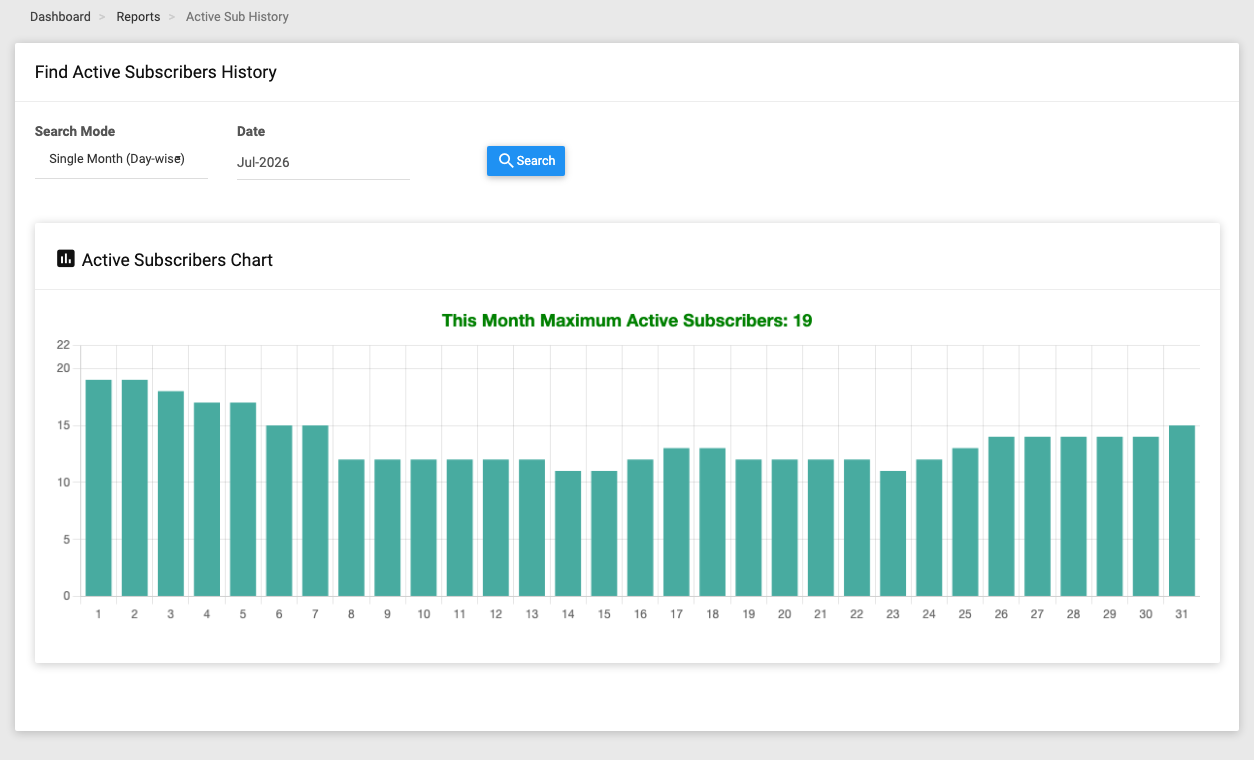
Use it when you want to see day-to-day or month-over-month movement in your active subscriber count.
Filters
| Filter | What it does |
|---|---|
| Search Mode | Single Month (Day-wise) or Multiple Months. |
| Date | (Day-wise mode) pick one month — the chart plots each day of it. |
| Date Range | (Multi-month mode) pick a from/to month range. |
- Day-wise shows a line chart of the active count for each day of the chosen month.
- Multiple Months shows a chart plus a table of each month's peak active count, with Total Months / Peak / Average / Min summarised.
This uses recorded daily snapshots, not a live count. Each month's figure is that month's highest single-day total. There is no per-customer list or file export here — the output is charts and summary figures.
Usage and Sessions
Menu: Reports → Usage / Session
The connection-session history from RADIUS accounting — every session a subscriber had: when it started and stopped, how long it lasted, how much data it used, and over which NAS / IP / MAC.
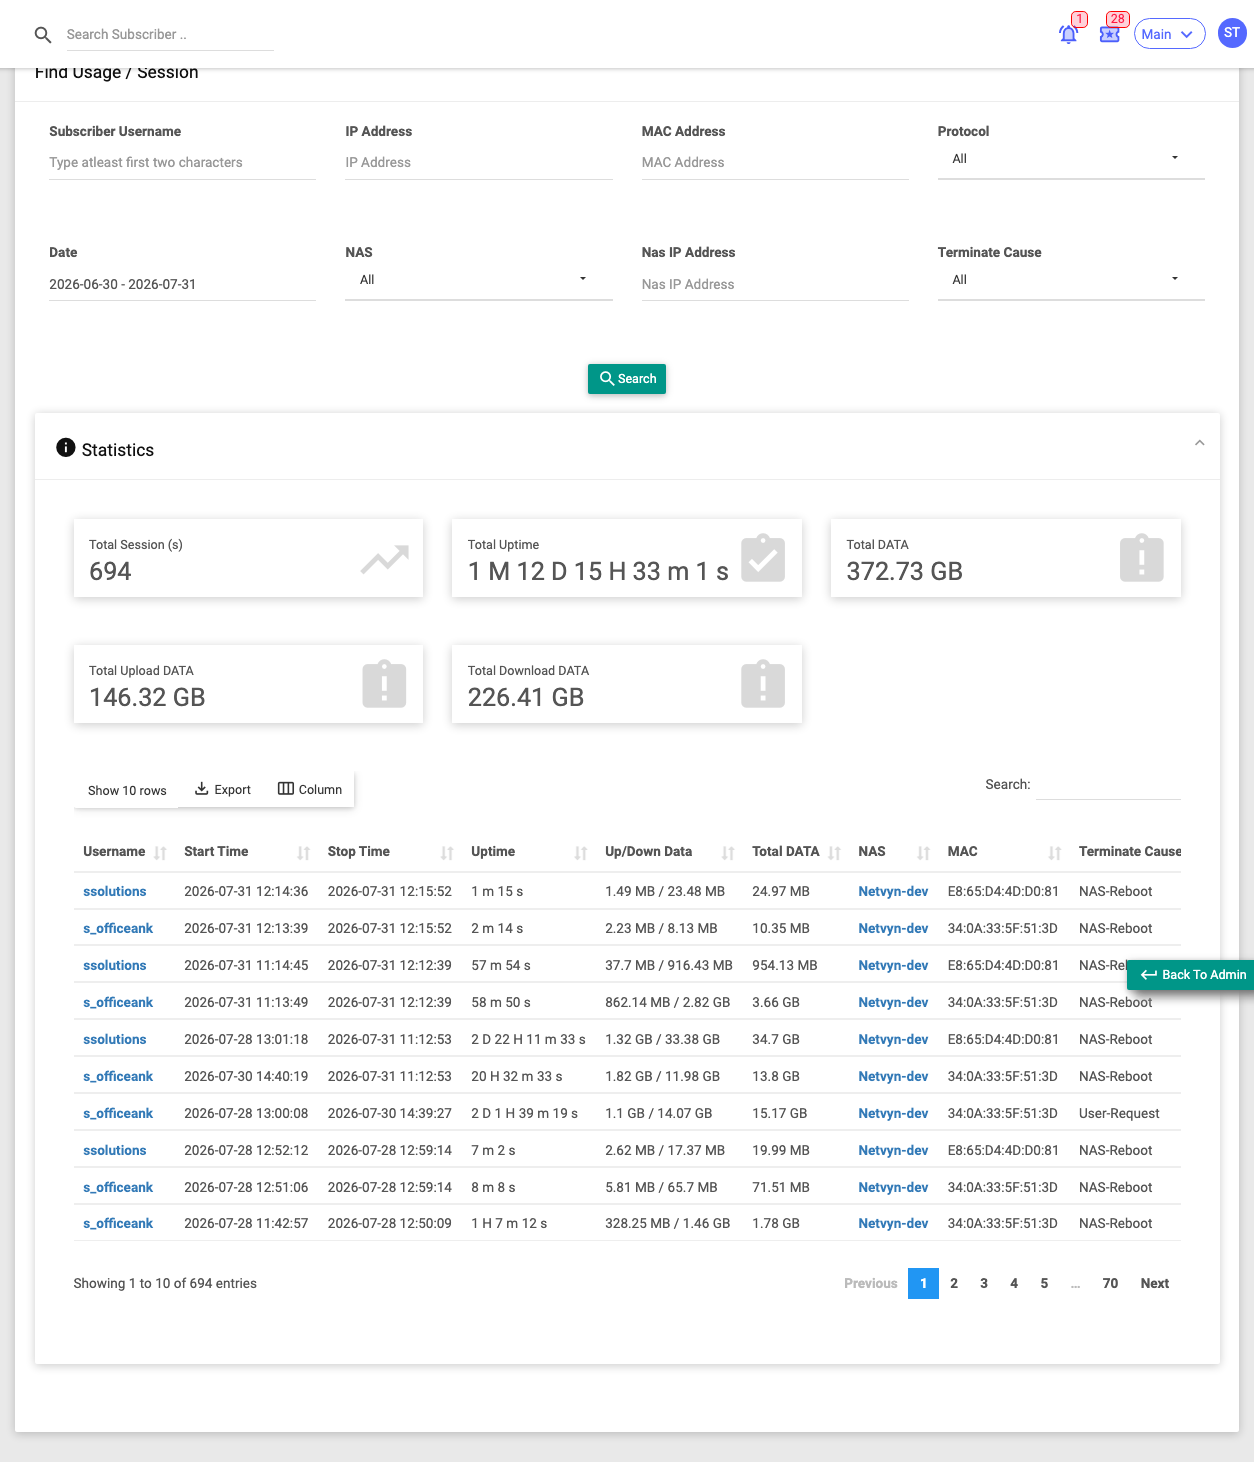
Use it when you need to verify a customer's data consumption or troubleshoot repeated disconnects.
Filters
| Filter | What it does |
|---|---|
| Subscriber Username | Type-ahead to a specific customer. |
| IP Address / MAC Address | Find sessions by the framed IP or the device MAC. |
| Protocol | All / PPPoE / Hotspot. |
| Date | Session start-time range. |
| NAS / NAS IP Address | Limit to one access device (by name or IP). |
| Terminate Cause | Filter by why the session ended (Idle-Timeout, User-Request, NAS-Reboot, Session-Timeout, and other RADIUS causes). |
Key columns: Username, Start / Stop / Updated Time, Uptime, Up/Down Data, Total Data, NAS, MAC, Protocol, framed IPv4/IPv6 details, NAS Port ID/Type, Terminate Cause, plus contact/account columns.
Summary tiles: Total Sessions, Total Uptime, Total Data, Total Upload, Total Download.
This is technical network data from RADIUS accounting. A NAS shown as Shared is used across multiple sites and can't be edited from here.
Offline Subscribers
Menu: Reports → Offline Subscribers
Lists subscribers who are not connected right now, how long they've been offline, and their last usage. It has two flavours — everyone offline, or only those who should be online but aren't.
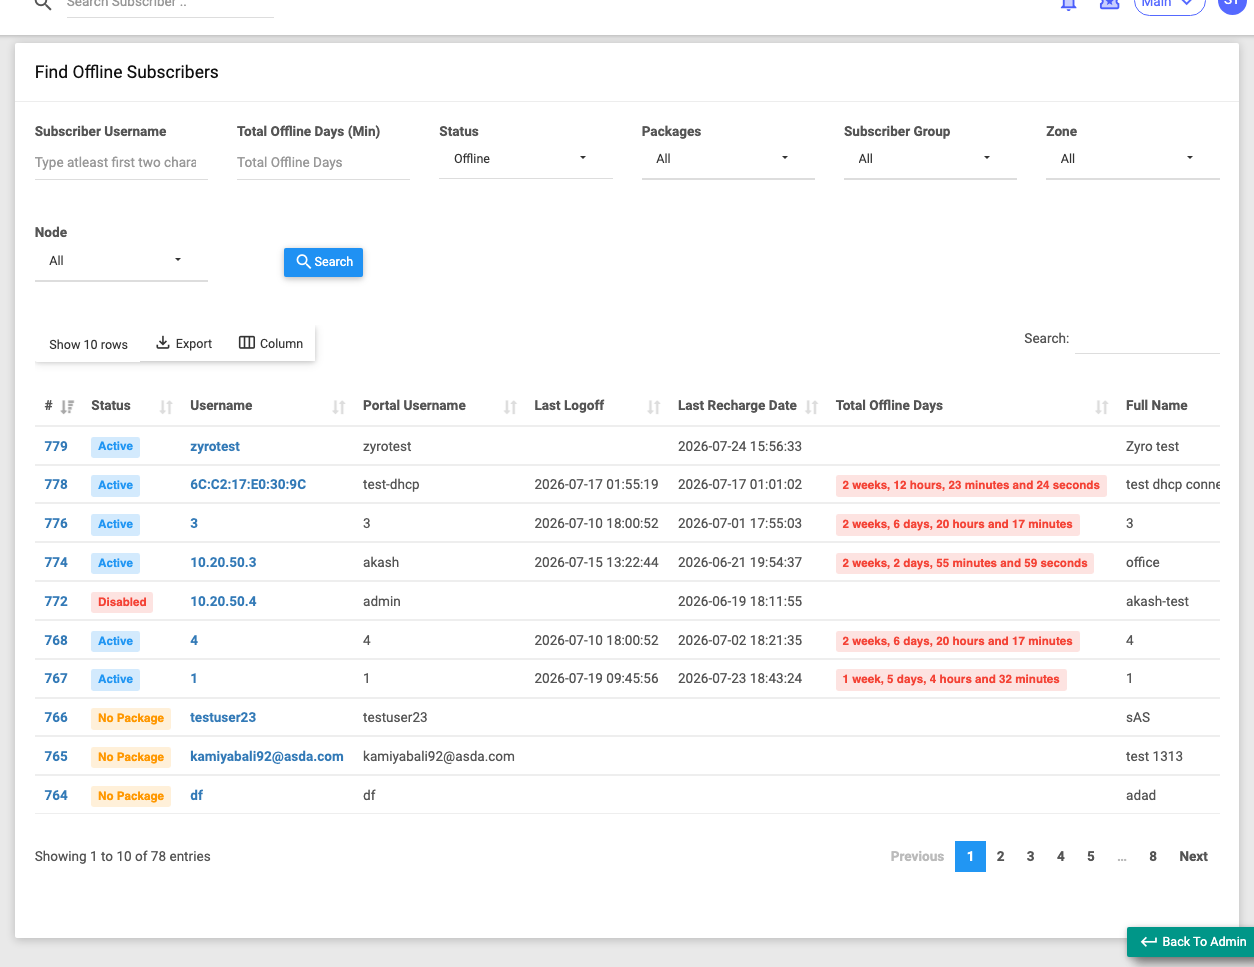
Use it when you want to spot paid-up customers who aren't using their service (a churn warning), or find accounts idle for a long time.
Filters
| Filter | What it does |
|---|---|
| Subscriber Username | Type-ahead to a specific customer. |
| Total Offline Days (min) | Show only accounts offline more than N days. |
| Status | Offline (everyone not online) or Active Offline. |
| Packages / Sub Group / Zone / Node | Narrow the list. |
- Offline simply means the subscriber isn't in the currently-online set.
- Active Offline is a stricter subset: the account is enabled, not suspended, verified, has a package, and is still within its data/uptime/expiry limits — so it should be able to connect but currently isn't.
Key columns: Status, Username, Last Logoff, Total Offline Days, Package, Expiry Date, Zone, Node, Total Usage, Daily Usage, plus contact columns.
Voucher accounts, deleted subscribers and permanently closed connections are excluded.