Statistics tab
Overview
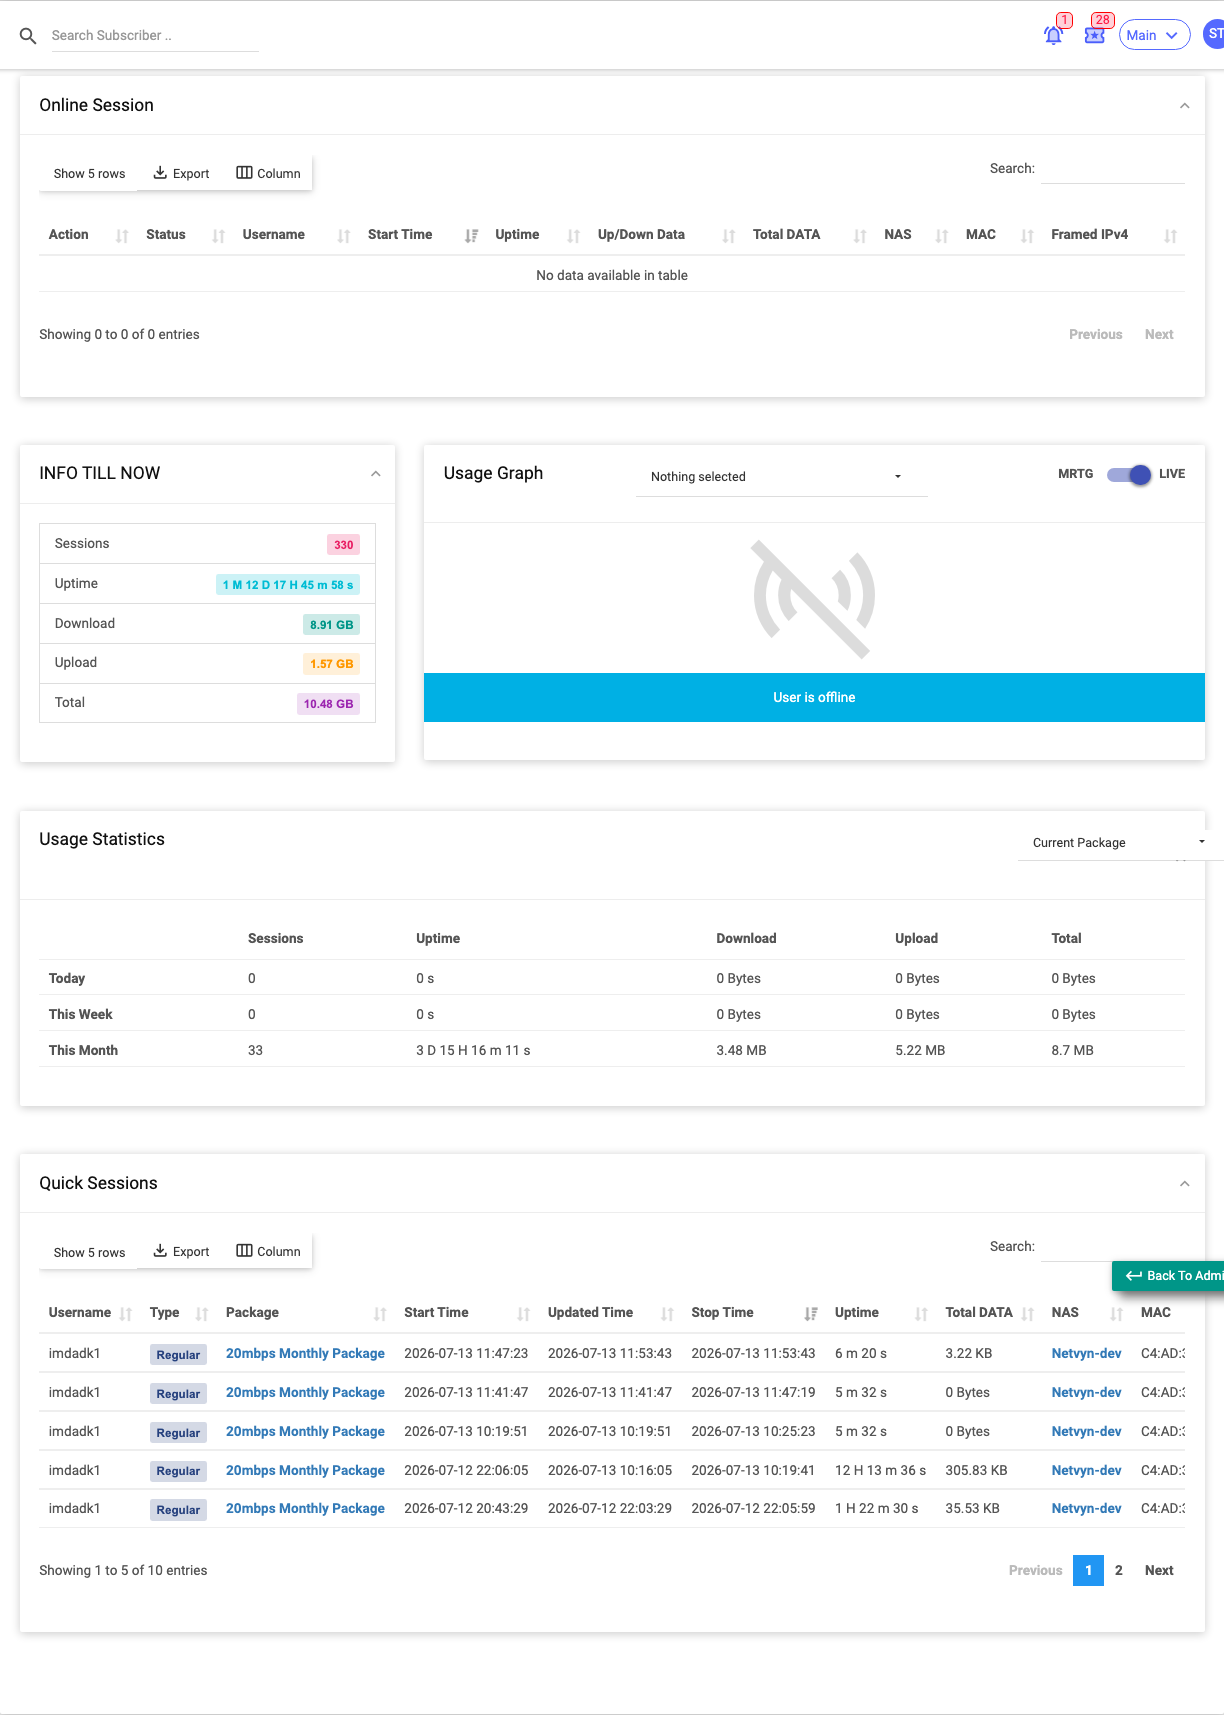
The Statistics tab shows how the subscriber is using their connection — their live/online session, cumulative usage, a usage graph, and a full session history. It's the tab you open to answer "are they online, and how much have they used?"
Required Permissions
- Subscriber → Show (statistics view).
Navigation
Subscribers → (open a subscriber) → Statistics
Online Session
If the subscriber is connected, their current session is shown:
| Column | Meaning |
|---|---|
| Status | Live session state. |
| Start Time / Updated Time / Uptime | When it began and how long it's run. |
| Up/Down Data / Total Data | Data used this session. |
| NAS / MAC / Protocol | Where and how they're connected. |
| Framed IPv4 / IPv6 (prefix, delegation, address) | The IPs assigned this session. |
| NAS Port ID / NAS Port Type / Called Station ID | Port and connection details. |
The Action column can disconnect the live session.
Info Till Now
A set of badges with lifetime totals: Sessions, Uptime, Download, Upload, Total.
Usage Graph
A traffic graph with controls to switch the period (Hourly, Daily, Weekly, Monthly, Yearly) and, in live mode, the framed IP. Toggle between MRTG (historical) and LIVE views.
Usage Statistics
A small table of usage broken down by Today / This Week / This Month, each with Sessions, Uptime, Download, Upload and Total. A filter switches between All usage and Current Package only.
Quick Sessions
The subscriber's session history — every past session with full detail (start/stop/uptime, up/down/total data, NAS, MAC, protocol, framed IPs, terminate cause, connect info, and more). Use it to investigate disconnections or disputed usage.
Important Notes
- Online here reflects a live RADIUS session; a subscriber can be Active but show no online session when offline.
- Usage figures drive FUP and data-limit behaviour — cross-check here if a customer is unexpectedly throttled.
Related Guides
- Auth Log — why a login was accepted or rejected (the first stop for "can't get online")
- Data & Time Limits (Reset Data Usage)